Exhibit 99.1
|
|
Scotia Howard Weil Energy Conference Jay Ottoson President and CEO March 23, 2015 |
Exhibit 99.1
|
|
Scotia Howard Weil Energy Conference Jay Ottoson President and CEO March 23, 2015 |
|
|
2 Forward Looking Statements - Cautionary Language Except for historical information contained herein, statements in this presentation, including information regarding the business of the Company, contain forward looking statements within the meaning of securities laws, including forecasts and projections. The words “anticipate,” “assume,” “believe,” “budget,” “estimate,” “expect,” “forecast,” “intend,” “plan,” “project,” “will,” and similar expressions are intended to identify forward looking statements. These statements involve known and unknown risks, which may cause SM Energy's actual results to differ materially from results expressed or implied by the forward looking statements. These risks include factors such as the availability, proximity, and capacity of gathering, processing and transportation facilities; the uncertainty of negotiations to result in an agreement or a completed transaction; the uncertain nature of announced acquisition, divestiture, joint venture, farm down, or similar efforts and the ability to complete any such transactions; the uncertain nature of expected benefits from the actual or expected acquisition, divestiture, joint venture, farm down, or similar efforts; the volatility and level of oil, natural gas, and natural gas liquids prices; uncertainties inherent in projecting future rates of production from drilling activities and acquisitions; the imprecise nature of estimating oil and gas reserves; the availability of additional economically attractive exploration, development, and acquisition opportunities for future growth and any necessary financings; unexpected drilling conditions and results; unsuccessful exploration and development drilling results; the availability of drilling, completion, and operating equipment and services; the risks associated with the Company's commodity price risk management strategy; uncertainty regarding the ultimate impact of potentially dilutive securities; and other such matters discussed in the “Risk Factors” section of SM Energy's 2014 Annual Report on Form 10-K, as such risk factors may be updated from time to time in the Company’s other periodic reports filed with the Securties and Exchange Commission. The forward looking statements contained herein speak as of the date of this announcement. Although SM Energy may from time to time voluntarily update its prior forward looking statements, it disclaims any commitment to do so except as required by securities laws. . |
|
|
Strategy and Asset Overview 3 Leverage operational efficiencies/scale Utilize industry leading technology to increase well performance Continue to increase the value and quantity of core program inventory Preserve financial strength and flexibility Williston Basin ~90 MMBOE (net) ~500 gross locations Eagle Ford ~900 MMBOE (net) ~1,050 gross locations Economic inventory(1) of approx. 1.0 BBOE in operated Eagle Ford and Bakken/Three Forks; nearly 20 times 2014 corporate production Potential to increase inventory by more than double without acquisitions Significant existing development inventory in each core program Focus on debt adjusted per share metrics Provide top quartile debt adjusted production, proved reserve, and EBITDAX growth Maintain low leverage How SM Energy will differentially grow shareholder value Operated Programs Economic inventory consists of projects expected to achieve at least a 20% rate of return at 5-yr average strip pricing as of 2/23/15 and expected well costs. |
|
|
4 Debt to TTM adjusted EBITDAX Note: 12/31/14 balance sheet and TTM EBITDAX data sourced from Bloomberg. Peer Group consists of CLR, COG, CXO, DNR, EGN, NFX, OAS, PXD, ROSE, RRC, UPL, WLL, WPX, XCO, and XEC. SM Energy’s December 31, 2014 debt to trailing twelve-month adjusted EBITDAX is below its peer median average of 2.3x. SM Top quartile leverage vs. peers |
|
|
Financial Position 5 Revolving Credit Facility 6.625% Senior Notes 6.50% Senior Notes Strong balance sheet with significant liquidity. First maturity is in 2019. Credit Facility: Matures in 2019 Borrowing base of $2.4 billion Commitments of $1.5 billion 6.125% Senior Notes 6.50% Senior Notes 5.00% Senior Notes 2019 |
|
|
2015 Operated Activity 6 Reducing rig activity and building WOC inventory |
|
|
2015 Capital Expenditures 7 Significantly reduced CAPEX program that yields YoY production growth Total CAPEX budget of $1,230 |
|
|
Financial Outlook 8 2015 CAPEX is expected to be ~$150 million in excess of 2015 adjusted EBITDAX.* Expecting quarterly adjusted EBITDAX to exceed quarterly CAPEX in 2H15.* Strong financial and liquidity position entering 2016. *Outspend and leverage amounts assume strip pricing as of 2/23/15 and do not take in to account proceeds from expected Mid-Continent asset divestiture. |
|
|
TEXAS Operated Eagle Ford Program 9 ~144,000 total net acres Mexico Dimmit Webb |
|
|
10 Operated Eagle Ford Type Log Upper EF Lower EF SM Energy has some of the thickest total Eagle Ford Shale interval in the play. Identified several targets within the Upper and Lower Eagle Ford based on facies work. Thickness and geo-mechanical variability presents an opportunity for increased inventory through stacking laterals. Potential Targets Austin Chalk |
|
|
Upper Eagle Ford East Testing 11 Proving up the viability of the Upper Eagle Ford Upper Eagle Ford East results are in-line with Lower Eagle Ford East type curve. |
|
|
Upper Eagle Ford North Testing 12 Proving up the viability of the Upper Eagle Ford Briscoe Catarina East 25H (Upper EF) Galvan Ranch LP GU5 State 20H North Area Type Curve (Upper EF) Upper Eagle Ford North results are in-line with Lower Eagle Ford North type curve. |
|
|
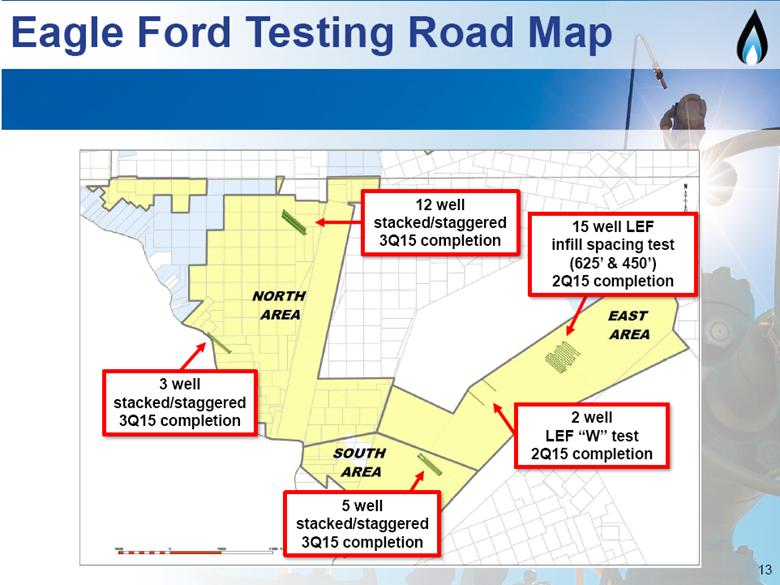
Eagle Ford Testing Road Map 13 12 well stacked/staggered 3Q15 completion 3 well stacked/staggered 3Q15 completion 2 well UEF “W” test 2Q15 completion 15 well LEF infill spacing test (625’ & 450’) 2Q15 completion 5 well stacked/staggered 3Q15 completion |
|
|
Eagle Ford North Stack/Stagger Pilot 14 ~85’ ~120’ 1 PAD Upper and Lower EF development well spacing in targeted facies ~70’ ~85’ ~120’ ~110’ 1 PAD Successful stack/stagger development of the Eagle Ford could more than double the current inventory of ~1,050 locations. |
|
|
Williston Basin Acreage 15 Divide Golden Valley Billings Dunn McKenzie Williams Roosevelt Sheridan Richland Wibaux Gooseneck: ~120,000 net acres Raven/Bear Den: ~40,000 net acres Total Williston Basin acreage: ~245,000 net acres |
|
|
Gooseneck Sweet Spot 16 Divide Burke Sheridan, MT Williams Decreasing reservoir quality Decreasing reservoir quality Sizeable acreage position in the sweet spot of Divide County, ND The geology deteriorates as you move east and west from the center section of Divide County. Decreasing thermal maturity Increasing water cut |
|
|
Gooseneck Three Forks vs. Offset Divide 17 Gooseneck Three Forks program outperforms offset operators Three Forks Type Curve Offset Operator Results |
|
|
Gooseneck Bakken 18 Middle Bakken Wells 2015 Planned Bakken Completions Successful development of the Gooseneck Bakken has the potential to double the current inventory of 400 identified Gooseneck Three Forks locations. Three Forks Type Curve Bakken Well Results Bakken wells in Gooseneck are outperforming the Three Forks type curve. |
|
|
19 Takeaways SM Energy enters 2015 with a strong balance sheet, significant liquidity, and a robust inventory in core programs. Potential to add meaningful inventory in core programs in current pricing environment. 2015 program positions SM Energy to exit this downturn as a strong competitor. |
|
|
20 Appendix |
|
|
21 4Q14 Regional Realizations NYMEX WTI OIL (Bbl) $ 73.16 Hart Composite NGL (Bbl) $ 29.53 NYMEX Henry Hub Gas (MMBTU) $ 3.77 Production Volumes STGC Rockies Mid-Con Permian SM Total Oil (MBbls) 2,164 2,326 27 582 5,099 Gas (MMcf) 34,961 2,239 5,381 1,295 43,876 NGL (MBbls) 3,675 60 25 0 3,760 MBOE 11,666 2,759 949 798 16,172 Revenue (in thousands) Oil $ 136,649 $ 142,082 $ 1,876 $ 38,607 $ 319,214 Gas 135,960 10,327 17,264 6,137 169,691 NGL 95,029 1,870 766 0 97,661 Total $ 367,638 $ 154,279 $ 19,906 $ 44,744 $ 586,566 Expenses LOE $ 29,267 $ 27,706 $ 5,384 $ 12,992 $ 75,299 Transportation $ 88,205 $ 3,640 $ 1,509 $ 31 $ 93,386 Production Taxes $ 8,637 $ 15,815 $ 544 $ 2,506 $ 27,496 Per Unit Metrics: Realized Oil/Bbl $ 63.14 $ 61.09 $ 69.23 $ 66.31 $ 62.60 % of Benchmark – WTI 86 % 84 % 95 % 91 % 86 % Realized Gas/Mcf $ 3.89 $ 4.61 $ 3.21 $ 4.74 $ 3.87 % of Benchmark – NYMEX HH 103 % 122 % 85 % 126 % 103 % Realized NGL/Bbl $ 25.86 $ 30.95 $ 30.60 $ 27.37 $ 25.97 % of Benchmark – HART 88 % 105 % 104 % 93 % 88 % Realized BOE $ 31.51 $ 55.91 $ 20.98 $ 56.07 $ 36.27 LOE/BOE $ 2.51 $ 10.04 $ 5.67 $ 16.28 $ 4.66 Transportation/BOE $ 7.56 $ 1.32 $ 1.59 $ 0.04 $ 5.77 Production Tax - % of Total Revenue 2.3 % 10.3 % 2.7 % 5.6 % 4.7 % * Totals may not sum due to rounding. |
|
|
22 2015 Guidance FY 2015 Production (MMBOE) 60.4 – 63.5 Average daily production (MBOE/d) 165 – 174 LOE ($/BOE) $4.40 – $4.65 Ad Valorem ($/BOE) $0.50 – $0.55 Transportation ($/BOE) $6.25 – $6.55 Production taxes (% of pre-derivative oil and gas revenue) 4.5% – 5.0% G&A – Cash ($/BOE) $2.50 – $2.80 G&A – Non-cash ($/BOE) $0.30 – $0.40 G&A Total ($/BOE) $2.80 – $3.20 DD&A ($/BOE) $13.00 – $13.80 Effective income tax rate range 36.3% – 37.5% % of income tax that is current <3% |
|
|
Operated Eagle Ford – East 23 Strong asset continues to provide top-tier returns. Assuming single interval development, SM Energy has identified more than 300 locations on its operated Eagle Ford East area. Webb Mexico Dimmit Economics(2) Well Cost (6,500’ lateral) $5.8MM IRR ~60% NPV10 ~$6.3 MM Assumes $3.50/mmbtu gas, 40% WTI NGL realizations, and 25% reduction from YE14 well costs. Utilizes assumptions from IRR sensitivity using $65/bbl oil. Current type curve Enhanced well design results |
|
|
Current type curve Operated Eagle Ford – North 24 Improved completions have enhanced this asset. Assuming single interval development, SM Energy has identified more than 500 locations on its operated Eagle Ford North area. Assumes $3.50/mmbtu gas, 40% WTI NGL realizations, and 25% reduction from YE14 well costs. Utilizes assumptions from IRR sensitivity using $65/bbl oil. Webb Mexico Dimmit Enhanced well design results Economics (2) Well Cost (8,000’ lateral) $6.5 MM IRR ~30% NPV10 ~$2.6MM |
|
|
Operated Eagle Ford – South 25 Wells in southern acreage provide an economic dry gas option. Assuming single interval development, SM Energy has identified more than 200 locations on its operated Eagle Ford South area. Webb Mexico Dimmit Historical well results Represents 25% reduction from YE14 well costs. Utilizes assumptions from IRR sensitivity using $3.50/mmbtu gas. Economics(2) Well Cost (8,000’ lateral) $6.1 MM IRR ~35% NPV10 ~$4.3 MM Current type curve |
|
|
Gooseneck – Three Forks 26 Under current assumptions, SM Energy has identified more than 400 Three Forks locations on its operated Gooseneck acreage. Divide Williams Substantial remaining inventory in our most economic Williston program. Economics(2) Well Cost (~10,000’ lateral) $4.1 MM IRR ~35% NPV10 ~$2.4 MM Current type curve Enhanced well design results Assumes $3.50/mmbtu gas, 40% WTI NGL realizations, and 25% reduction from YE14 well costs. Utilizes assumptions from IRR sensitivity using $65/bbl oil. |
|
|
Raven/Bear Den – Bakken 27 Under current assumptions, SM Energy has identified more than 75 Bakken locations on its operated Raven/Bear Den acreage. Williams McKenzie Economics(2) Well Cost (~10,000’ lateral) $6.8 MM IRR ~30% NPV10 ~$3.1 MM Current type curve Enhanced well design results Assumes $3.50/mmbtu gas, 40% WTI NGL realizations, and 25% reduction from YE14 well costs. Utilizes assumptions from IRR sensitivity using $65/bbl oil. |
|
|
28 Adjusted EBITDAX Reconciliation Adjusted EBITDAX (1) (in thousands) Reconciliation of net income (GAAP) to Adjusted EBITDAX (non-GAAP) to net cash For the Three Months Ended provided by operating activities (GAAP): December 31, 2014 2013 Net income (GAAP) $331,726 $6,996 Interest expense 27,703 24,541 Other non-operating (income) expense, net 68 (3) Income tax expense 198,988 8,755 Depletion, depreciation, amortization, and asset retirement obligation liability accretion 219,277 202,640 Exploration (2) 47,881 20,105 Impairment of proved properties 84,480 110,935 Abandonment and impairment of unproved properties 57,151 37,646 Stock-based compensation expense 8,126 6,852 Derivative (gain) loss (616,734) 11,605 Derivative settlement gain (3) 75,509 9,347 Change in Net Profits Plan liability (14,569) (15,419) Gain on divestiture activity (594) (28,484) Adjusted EBITDAX (Non-GAAP) $419,012 $395,516 Interest expense ($27,703) ($24,541) Other non-operating (income) expense, net (68) 3 Income tax expense (198,988) (8,755) Exploration (2) (47,881) (20,105) Exploratory dry hole expense 21,583 (32) Amortization of deferred financing costs 1,713 1,476 Deferred income taxes 199,600 6,936 Plugging and abandonment (2,603) (2,493) Other, net 4,003 (154) Changes in current assets and liabilities 12,785 (10,206) Net cash provided by operating activities (GAAP) $381,453 $337,645 (1) Adjusted EBITDAX represents income (loss) before interest expense, interest income, income taxes, depreciation, depletion, amortization, and accretion, exploration expense, property impairments, non-cash stock compensation expense, derivative gains and losses net of settlements, change in the Net Profits Plan liability, and gains and losses on divestitures. Adjusted EBITDAX excludes certain items that we believe affect the comparability of operating results and can exclude items that are generally one-time in nature or whose timing and/or amount cannot be reasonably estimated. Adjusted EBITDAX is a non-GAAP measure that is presented because we believe that it provides useful additional information to investors and analysts, as a performance measure, for analysis of our ability to internally generate funds for exploration, development, acquisitions, and to service debt. We are also subject to a financial covenant under our credit facility based on our debt to adjusted EBITDAX ratio. In addition, adjusted EBITDAX is widely used by professional research analysts and others in the valuation, comparison, and investment recommendations of companies in the oil and gas exploration and production industry, and many investors use the published research of industry research analysts in making investment decisions. Adjusted EBITDAX should not be considered in isolation or as a substitute for net income (loss), income (loss) from operations, net cash provided by operating activities, or profitability or liquidity measures prepared under GAAP. Because adjusted EBITDAX excludes some, but not all items that affect net income (loss) and may vary among companies, the adjusted EBITDAX amounts presented may not be comparable to similar metrics of other companies. (2) Stock-based compensation expense is a component of exploration expense and general and administrative expense on the accompanying statements of operations. Therefore, the exploration line items shown in the reconciliation above will vary from the amount shown on the accompanying statements of operations for the component of stock-based compensation expense recorded to exploration. (3) Derivative settlement gain represents the portion of derivatives which were settled as of December 31, 2014. This amount is comprised of derivative cash settlements and a portion of changes in the accounts receivable and changes in accounts payable and accrued expenses line items on the accompanying statements of cash flows. The portion of changes in accounts receivable and changes in accounts payable and accrued expenses included in Derivative settlement gain was $36.1 million for the three-month period ended December 31, 2014. |
|
|
29 Oil Derivative Position* Oil Swaps - NYMEX Equivalent Bbls $/Bbl 2015 Q1 1,711,000 $ 91.96 Q2 1,639,000 $ 91.26 Q3 1,254,000 $ 90.78 Q4 1,137,000 $ 90.15 2015 Total 5,741,000 2016 Q1 1,868,000 $ 86.93 Q2 1,752,000 $ 86.73 Q3 1,170,000 $ 90.29 Q4 780,000 $ 90.05 2016 Total 5,570,000 Grand Total 11,311,000 *Includes all commodity derivative contracts for settlement at any time during the first quarter of 2015 and later periods entered into as of February 18, 2015 Oil Collars - NYMEX Equivalent Ceiling Floor Bbls $/Bbl $/Bbl 2015 Q1 882,000 $ 99.53 $ 85.00 Q2 709,000 $ 94.06 $ 85.00 Q3 906,000 $ 91.25 $ 85.00 Q4 869,000 $ 92.19 $ 85.00 2015 Total 3,366,000 Grand Total 3,366,000 |
|
|
30 Gas Derivative Position* Natural Gas Swaps - NYMEX Equivalent Natural Gas Collars - NYMEX Equivalent Ceiling Floor MMBTU $/MMBTU MMBTU $/MMBTU $/MMBTU 2015 2015 Q1 23,548,000 $ 4.25 Q1 2,525,000 $ 4.31 $ 4.01 Q2 15,985,000 $ 3.97 Q2 2,296,000 $ 4.34 $ 4.04 Q3 14,950,000 $ 4.09 Q3 2,005,000 $ 4.33 $ 4.03 Q4 13,570,000 $ 4.10 Q4 6,176,000 $ 4.39 $ 4.06 2015 Total 68,053,000 2015 Total 13,002,000 2016 Q1 18,159,000 $ 4.31 Grand Total 13,002,000 Q2 9,130,000 $ 4.01 Q3 7,004,000 $ 4.08 Q4 14,603,000 $ 4.04 2016 Total 48,896,000 2017 Q1 14,334,000 $ 4.15 Q2 5,974,000 $ 4.11 Q3 5,712,000 $ 4.10 Q4 11,394,000 $ 4.12 2017 Total 37,414,000 2018 Q1 9,343,000 $ 4.25 Q2 8,974,000 $ 4.11 Q3 8,615,000 $ 4.11 Q4 8,309,000 $ 4.17 2018 Total 35,241,000 2019 Q1 8,021,000 $ 4.39 Q2 7,759,000 $ 4.11 Q3 7,506,000 $ 4.17 Q4 4,873,000 $ 4.23 2017 Total 28,159,000 Grand Total 217,763,000 *Includes all commodity derivative contracts for settlement at any time during the first quarter of 2015 and later periods entered into as of February 18, 2015 |
|
|
31 NGL Derivative Position* Natural Gas Liquid Swaps - Mont. Belvieu Bbls $/Bbl 2015 Q1 781,000 $ 55.42 2015 Total 781,000 Grand Total 781,000 *Includes all commodity derivative contracts for settlement at any time during the first quarter of 2015 and later periods entered into as of February 18, 2015 |